Improving Accessibility in a Global App Marketplace
Project Type: Evaluative, usability testing
My Role: Lead UX Researcher
Methods: Accessibility audit; remote, moderated usability testing
Duration: 7 weeks, 2022
Please note, this project is under NDA and highlights process and reasoning over specific
details and insights.
TL;DR | Remote, moderated usability study designed to evaluate and improve accessibility across key customer journeys for users with assistive technology.
Overview
As part of a company-wide accessibility initiative, our client engaged us to evaluate the accessibility of their app store, focusing on five high-priority customer journeys (CUJs).
I conducted a remote, mixed-method usability study with 30 participants (10 blind, 10 with low vision, and 10 with upper body mobility limitations) each using different assistive technologies. (ATs). The study combined qualitative usability observations with quantitative performance metrics to identify accessibility barriers, benchmark CUJ performance, and provide a benchmark for accessibility barriers and performance over time.
In addition to usability testing, I conducted a pre-study accessibility audit to anticipate barriers and prepare targeted probes. Findings from both the audit and the usability testing were synthesized into actionable recommendations, prioritized by severity and scope, and delivered in formats tailored for accessibility engineers, product teams, and executives.
Impact
This project gave the client both immediate and long-term value. By aligning early with their broader accessibility goals, I ensured the work directly supported their company-wide strategy and met established accessibility standards.
The diverse participant mix revealed both systemic barriers affecting all assistive technology users and unique challenges tied to specific tools, giving the team a nuanced view of where fixes would have the most impact.
Finally, the prioritized, actionable recommendations empowered engineering and product teams to address the most critical issues first, while equipping leadership with a clear, evidence-backed view of accessibility progress across the app store experience.
My Contributions
I led the project from stakeholder alignment through execution, analysis, and delivery:
- Set the research direction in alignment with the client’s broader accessibility goals.
- Designed the study, co-defining optimal task flows and selected relevant quantitative/qualitative metrics.
- Conducted an accessibility audit to anticipate barriers before testing.
- Personally moderated all 30 remote usability sessions.
- Synthesized and presented findings in an actionable, prioritized format to broad stakeholders.
Research Process
Project Genesis
Our Fortune 50 client, as part of a company-wide accessibility initiative, approached us to evaluate the accessibility of their global app marketplace. The goal of the study was to identify and resolve usability issues that impacted assistive technology users when performing critical tasks.
Phase 1 — Align (Week 1)
Goal: Ensure the stakeholder priorities were identified and the study objectives were directly tied to the company’s larger accessibility strategy and standards.
KICK OFF WORKSHOP
At the start of the project, my team and I met with key stakeholders to:
Understand their broader accessibility initiative.
Learn their standards and success metrics for accessibility research.
Identify any in-progress accessibility work that might affect the study.
Review the project timeline to address any potential issues early.
In this meeting, I asked detailed questions to clarify:
What success looked like to this team at the end of the project?
What insights were most important to capture during sessions?
How the results of the study should be reported to ensure insights were relevant to the appropriate teams?
How this project would integrate into their broader roadmap?
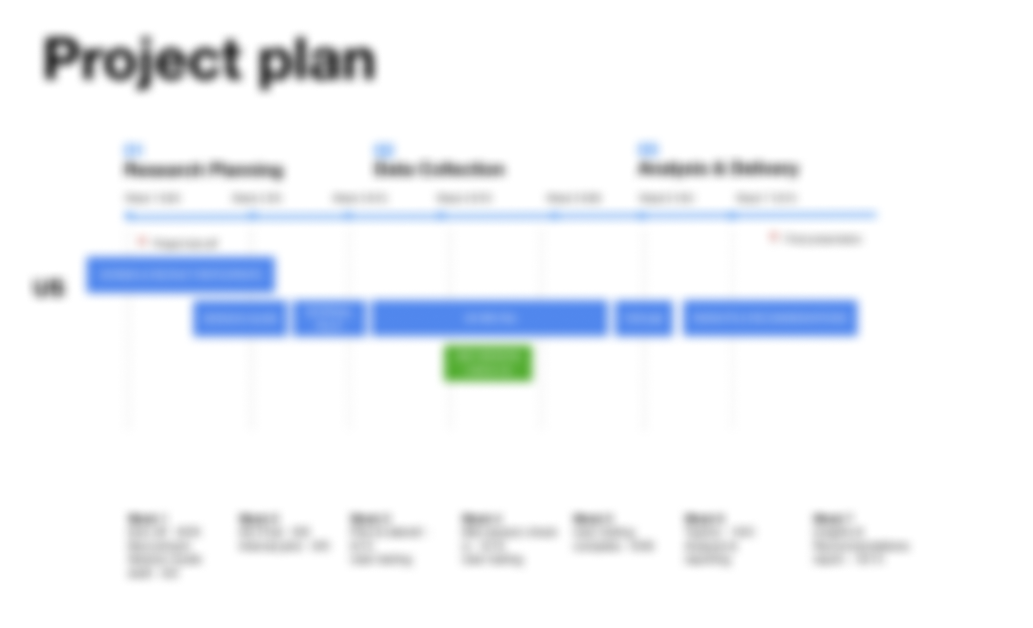
Image: Shows project plan that was reviewed during our kick off workshop with the client.
Phase 2 — Define & Design (Week 2)
Goal: Define critical CUJs, metrics, and design the accessibility study.
1| DEFINE CUSTOMER JOURNEYS
I began the research process by meeting with the client’s accessibility leads to align on goals, understand the scope of their broader accessibility initiative, and define the five CUJs (Customer Journeys) most critical to the app store experience: adding a payment method, getting a refund, adding a subscription, cancelling a subscription, and making a purchase.
In the defining process, we created scenarios to present to the participants to give them context as well as defined the task explicitly.

The image above shows the visual used to document the agreed upon scenarios and tasks.
2| SELECT KEY METRICS
Together, we selected the metrics that would best capture both success and usability across these journeys. We selected both quantitative and qualitative data to capture a holistic view of participants performance and experience. At this time, we also operationalized each metric so all stakeholders shared a consistent definition.

3| STUDY DESIGN
Each participant completed all five CUJs to ensure comprehensive coverage of the core app store flows. We implemented partial counterbalancing of task order to reduce learning effects while keeping the session manageable, striking a balance between methodological rigor and participant cognitive load. This approach helped ensure that performance differences were driven by task difficulty or accessibility barriers, rather than by the order in which tasks were attempted.
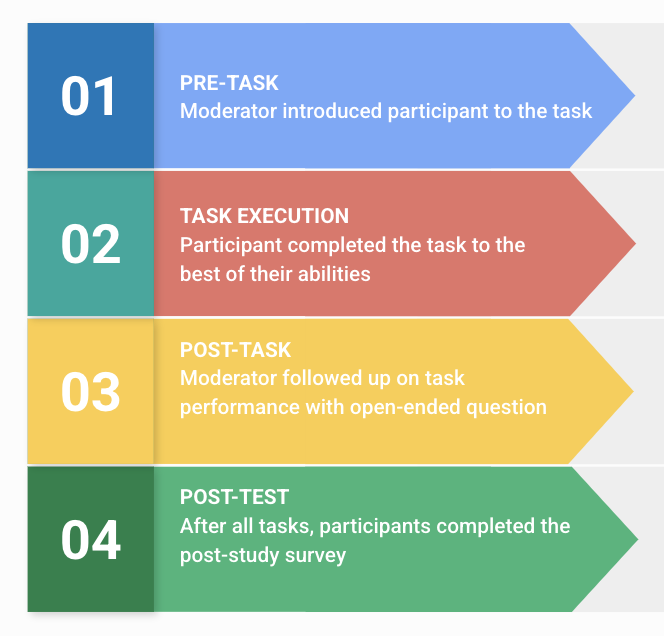
Before each task, we asked participants to rate their familiarity with the specific task. This allowed us to analyze whether prior experience influenced performance, which could help distinguish between true usability issues and novice learning curves.
During task execution, we used a think-aloud protocol, even though we initially debated whether to exclude it in favor of more accurate time-on-task measurements. We ultimately decided that the rich qualitative insights from hearing participants’ in-the-moment reasoning would outweigh the trade-off in timing precision.
After participants either completed the task or reported that they were finished (even if unsuccessful), the moderator:
Recorded task completion status and any observable issues.
Administered post-task questions to capture immediate reflections and perceived difficulty.
Once all five tasks were completed (following the same sequence for each participant), we administered a post-study survey to collect attitudinal feedback on the overall experience, perceived accessibility, and confidence in using the app marketplace independently.
4| PARTICIPANT SELECTION
The image above shows the visual used to document the agreed upon metrics and their operationalized definitions.
Why 30 Participants?
Balance between statistical confidence and qualitative depth
While accessibility research often relies heavily on qualitative insights, we needed enough participants in each accessibility group to identify recurring patterns and compare findings across groups.Even distribution across disability categories
By recruiting 10 participants in each group (blind, low vision, upper body mobility limitations), we ensured that no one group’s feedback would be overshadowed and that results could be meaningfully segmented.Sample size large enough to detect consistent barriers
With 10 participants per group, we had enough representation to spot both systemic issues and assistive-technology-specific problems that might only emerge for a subset of users.Practical constraints
Testing with participants using assistive technology requires longer sessions and more moderator preparation time. Thirty sessions allowed for robust coverage while still being feasible within project timelines.
Why These Participant Types?
Direct alignment with the client’s accessibility priorities
The client’s broader initiative targeted improving the experience for users with visual impairments and mobility challenges, so we focused recruitment on those groups.Representation of assistive technology diversity
Each group included participants using different screen readers, magnification tools, voice input software, or alternative input devices. This allowed us to observe how design and code interacted with various AT setups.Coverage of both sensory and motor accessibility needs
By testing with both vision-related and mobility-related disabilities, we were able to identify whether issues were universal barriers or specific to one category of impairment.
Phase 3 — Execute & Analyze (Week 3-6)
Goal: Conduct moderated, remote sessions across a diverse set of participants with various assistive technology configurations.
1|ACCESSIBILITY AUDIT
2| SESSION MODERATION
Prior to moderating the usability testing, I conducted a pre-study accessibility audit of the app marketplace against WCAG and platform-specific accessibility guidelines. The results of the audit allowed me to…
Identified known barriers and flagged them internally.
Prepare session plans with additional probes for areas likely to cause trouble.
Create contingency navigation plans for participants to keep sessions productive.
The audit created a more efficient sessions and enabled me to collected richer data as the issues found were framed as “confirmed by participants” rather than discovered in a vacuum.
Over the course of two weeks, I conducted 31 (we were able to keep our pilot participants data!) remote, moderated usability sessions with participants. Some of the key takeaways from running those sessions….
Challenges:
Technical variability: Different OS versions, browser settings, and assistive tech tools created unpredictable behaviors.
Compatibility issues: Some assistive tech struggled with the app’s custom components.
Session pacing: Some CUJs took longer for certain tech setups; built buffer time into the schedule to prevent rushed testing.
Real-time problem-solving:
Adjusted navigation instructions on the fly while preserving task validity.
Used a shared troubleshooting log to avoid repeating fixes across sessions.
3| TRACKING AND ANALYSIS
As I was conducting sessions, I knew the volume of data collected could easily become overwhelming. My goal was to turn the large volume of qualitative and quantitative data into a clear, actionable insights.
To do this I…
Logged every observation and quantitative data in a central, shared dashboard.
Linked qualitative notes (frustrations, workarounds, quotes) to quantitative outcomes.
This tracking method allowed me to quick identify systemic issues (e.g., the same interaction pattern failing across multiple assistive tech types) as they emerged and ensured no data was missing.
Once all of the data was collected from all 30 sessions, I used the following analysis process.
Thematic analysis of qualitative notes to identify recurring patterns and unique edge cases.
Cross-referenced patterns with CUJ performance data to validate severity and scope.
Clustered findings by CUJ, demographic, and by assistive tech type.
Conducted statistical analysis using descriptive statistics.
Phase 5 — Synthesize & Present (Week 7)
Goal: Synthesize and present findings in a way that was both technically precise for engineers and strategically clear for product owners.
Over the course of 5 days following the final usability session, I synthesized my findings in a comprehensive report that…
Prioritized list of accessibility issues by severity and prevalence.
Recommendations mapped to CUJs.
Screenshots + annotated examples for developer clarity.
Provided an executive summary for leadership:
High-level accessibility health overview.
Key success metrics.
Next-step recommendations.
Remediation tracking tool:
Dashboard handed off so the team could track fixes and retest progress over time.

Image above shows an example of an overview slide in the final presentation deck.
Learnings
Partial counterbalancing worked well for learning effects
By rotating task order,I avoided skewed results from participants “getting better” at similar flows as the session went on.
Think-aloud was worth the trade-off
While it slightly impacted time-on-task metrics, hearing participants’ mental models and frustrations in real time revealed issues that pure performance metrics would have missed, especially with assistive tech users who often under-report issues because they assume it is their fault.
Operationalizing metrics early improved analysis
Defining “success,” “error,” and “completion” criteria before sessions made moderator recording consistent and allowed for a cleaner, faster synthesis phase.
Dashboards made stakeholder buy-in easier
Having a visual, living document that combined quantitative results with key quotes gave stakeholders a clear, accessible view of issues without waiting for a full report.